
Ahead of the start of Sodalytics we took a bunch of datasets to analyse several industries – again and again we stumbled upon the same pattern: posts from brand accounts reaching astronomical heights with no engagement, like one example in the car industry with 25.8 million views and just 40 comments.
Forty comments, about half of them are just emojis and only seven(!) actually talk about the product at all. That’s one comment for every 645,000 people who saw it and one topic-related comment for every 3.7 million people. Posts that find their audience on their own don’t look like this. Somebody clearly put paid budget behind it.
If you benchmark your channel against your competitors and a post like that sits in their top ten, your benchmark gets badly distorted. This article explains how we keep those posts out, and why we never give you a single number for how much of a field’s reach was paid.
What the ad label actually tells you
Yes, TikTok marks some posts with an ad label, but this isn’t the answer to separate posts with and without media budget.
The label is a disclosure for commercial content. Some brands may tick it by default. It tells you a post has been used to advertise in some capacity, but it doesn’t tell you whether the post was pushed at all or how hard. A brand can label a post and put no media budget behind it, or run a post hard without the label ever showing in the data you can see. We see the second case especially with smaller brands. When looking at local German burger stores, 35 of the 129 pushes we found carry no label at all.
So we start label-blind: we judge a post by how it performed and check the label afterwards.
Reach that outran engagement
Media budget gets a post seen. Whether those viewers react to it is a different matter, and people who scroll into a promoted post didn’t go looking for it, so most of them keep scrolling.
When an organic post takes off, its engagement usually grows along with its reach. With pushed posts the reach grows much faster. We measure that gap for every post against the account’s own normal level. A creator with a chatty community and a brand with a quiet one need different baselines, so a fixed industry number wouldn’t work.
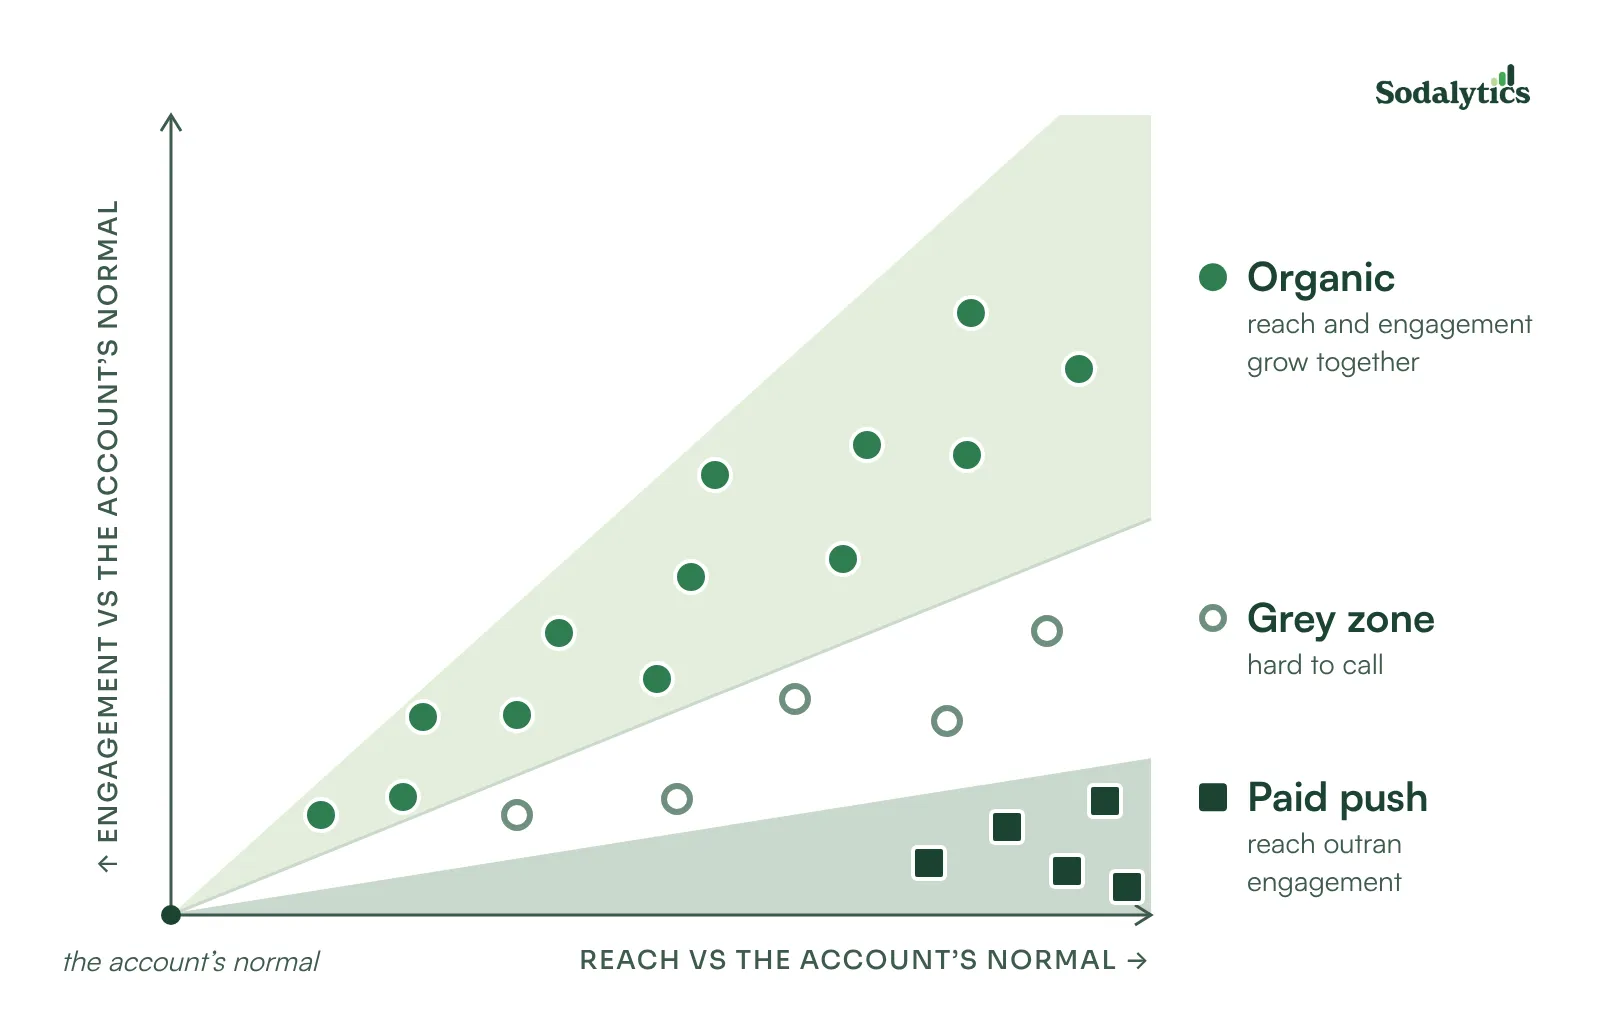
In every one of our seven fields, the biggest post carries the ad label, and all seven have an engagement rate under 0.3%. Paid pushes in our data run at 0.1 to 0.6% engagement; organic posts in the same fields run at 3.3 to 7.9%. Per thousand views paid posts get between 17 and 128 times fewer comments than organic ones.
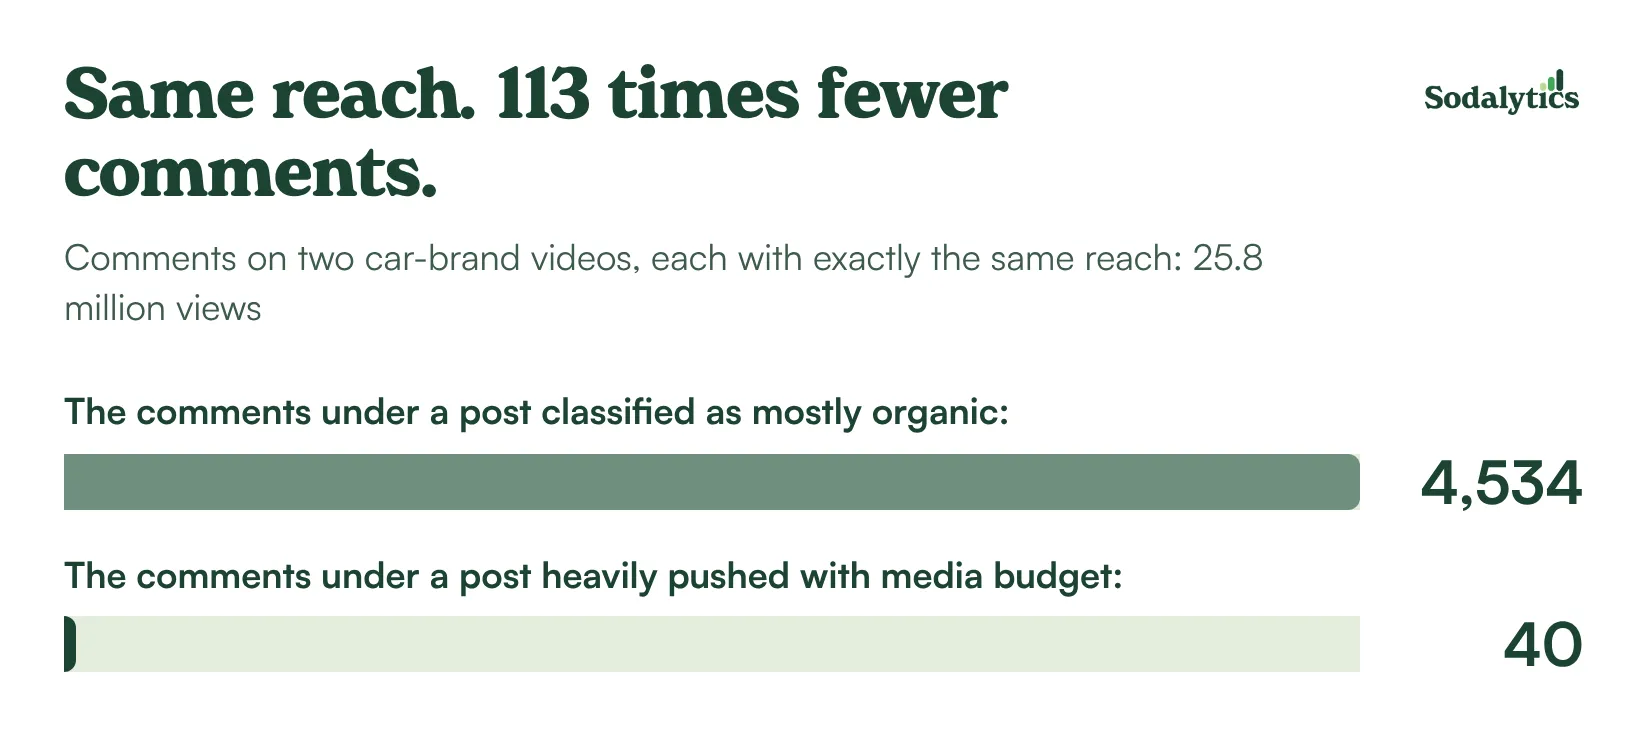
Posts that go viral without budget keep most of their engagement, even at ten or a hundred times their usual reach.
Why we work with ranges
Once you’ve separated paid from organic, it’s tempting to sum it up in one number, something like “40% of this industry’s reach was paid.” We’d have to guess to get there, so we don’t.
Some posts are clearly pushed, with huge reach and almost no reaction, and some are clearly organic. In between sits a grey zone, for example posts that did well on their own and were boosted afterwards, or posts on accounts whose engagement is naturally low. Where you draw the line in that zone moves the answer. So we give you two figures: a floor that counts only the clear pushes, and an estimate that adds the grey zone.
To account for these grey areas it is important to know your niche. At Sodalytics we first analyse your competitors’ benchmarks and your audience’s behaviour and then set individualised benchmarks for this set.
What this means for your benchmarking
As foggy as the image is: Try to compare organic with organic.
When a competitor’s top post is a paid push, it mostly reflects their media budget. If it ends up in your benchmark, it skews everything built on top of it, from average views to the engagement rate you think you’re behind on.
Once the paid pushes are removed, median views drop to their real level (and engagement rates rise). Some formats that looked unbeatable turn out to have been sponsored, and your own organic posts may rank higher in the field than you thought.
That is why our reports show median views for organic posts only and give the paid share as a floor and an estimate. We also mark how much of each channel’s reach was earned and how much was paid for.
Method note
Paid reach estimated with the Sodalytics Ad Estimate v2, which reads the gap between a post's reach and its engagement, measured against each account's usual level. Shares shown as a floor and an estimate. Data: 318 accounts, 31,626 videos, TikTok, 1 Oct 2025 – 7 Oct 2026, seven fields.